
[2018-07-03 edit: The original name of this feature was XE Profiler, but it was changed to XEvent Profiler in SSMS 17.4.]
I have a favourite new feature of SQL Server Management Studio 17 (SSMS), and that’s XEvent Profiler, which allows you to monitor your instance in real time using Extended Events from inside SSMS with just the click of a mouse.
So is it Extended Events or Profiler?
Let’s talk about the name XEvent Profiler quickly. It seems carelessly thought out because Microsoft is blurring the lines between Extended Events (an asynchronous, low-overhead advanced monitoring feature introduced in SQL Server 2008) and SQL Server Profiler (a resource-intensive, synchronous monitoring tool, introduced in the Ancient Times).
Profiler’s main problem is that if you decide to run it against a live instance of SQL Server, the way most people do, it writes every action into a scrolling window, which adds a lot of overhead, thus being the bane of database administrators. This performance overhead can be mitigated to some degree by using a server-side trace, where the profiler rules are written to a file on the server’s hard drive instead of a scrolling window.
Not a lot of accidental DBAs know about server-side trace, so Profiler continues to dominate as a performance monitoring tool that ironically makes performance worse.
I submit that XEvent Profiler is exactly meant to blur the lines between Extended Events (XE) and SQL Server Profiler (Profiler).
Its existence in the main user interface that most people use to administer SQL Server is inspired. Calling it XEvent Profiler means that it has enough similarity in name to an existing (but much slower) feature. People are more likely to click there than open up a brand new application from a menu.
No love for XEvent Profiler
Some people are less convinced about XEvent Profiler. For example, my friend Dave Mason writes on Twitter:
https://twitter.com/BeginTry/status/922295248583315456
He goes on to call it a gimmick. Dave’s argument seems to be that Extended Events (XEvents) has been in the product since SQL Server 2008, and therefore XEvent Profiler should not be heralded as something wonderful and new because we have all been running Extended Events for almost ten years already, and we all have scripts ready to go at a moment’s notice. Right? Right? Bueller?
Dave does, maybe. The vast majority of people looking after a SQL Server instance? Not so much.
It is a gimmick, which is a good thing
Andy Mallon (far more eloquently than I) proceeded to explain in that thread that this is an excellent feature for people who don’t use Extended Events already, or for people who think Profiler is faster than Extended Events. And by my estimation, there are a lot of them out there. Its very nature as a gimmick—as a quick and easy interface to an existing feature—makes it simpler to use.
Even better, there are only two sessions you can run on XEvent Profiler.
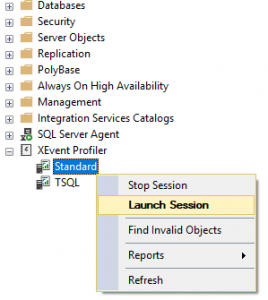
To run a session, scroll down to XEvent Profiler, expand the node to show the two sessions, right click on one of them and click Launch Session (session-ception).
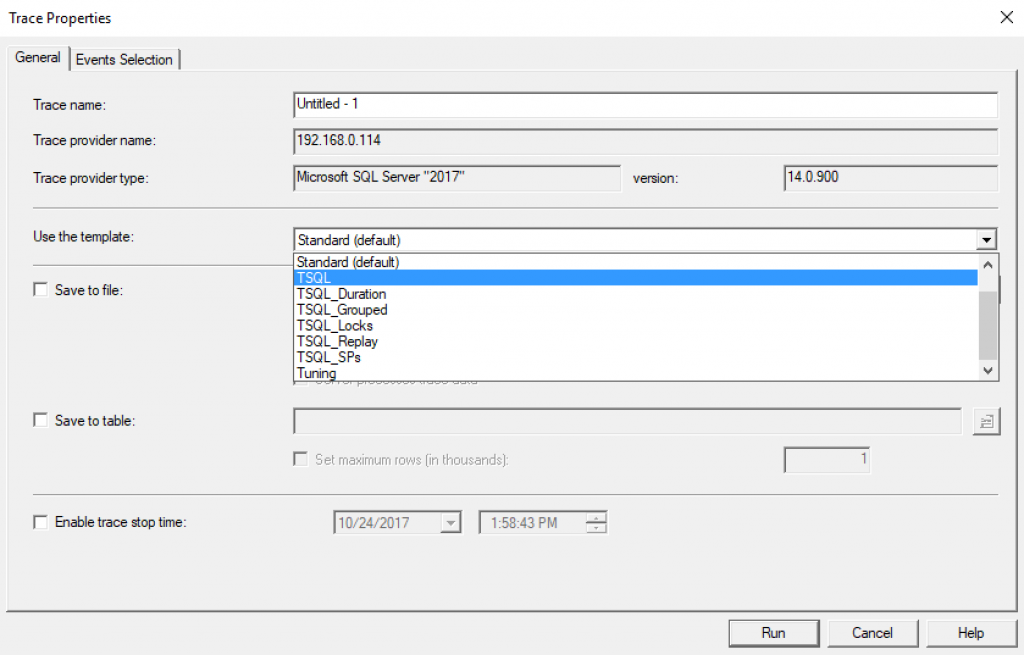
These happen to coincide with the two most common profiler traces that people use on SQL Server Profiler: Standard and TSQL, and, even better, they show the same stuff inside Management Studio.
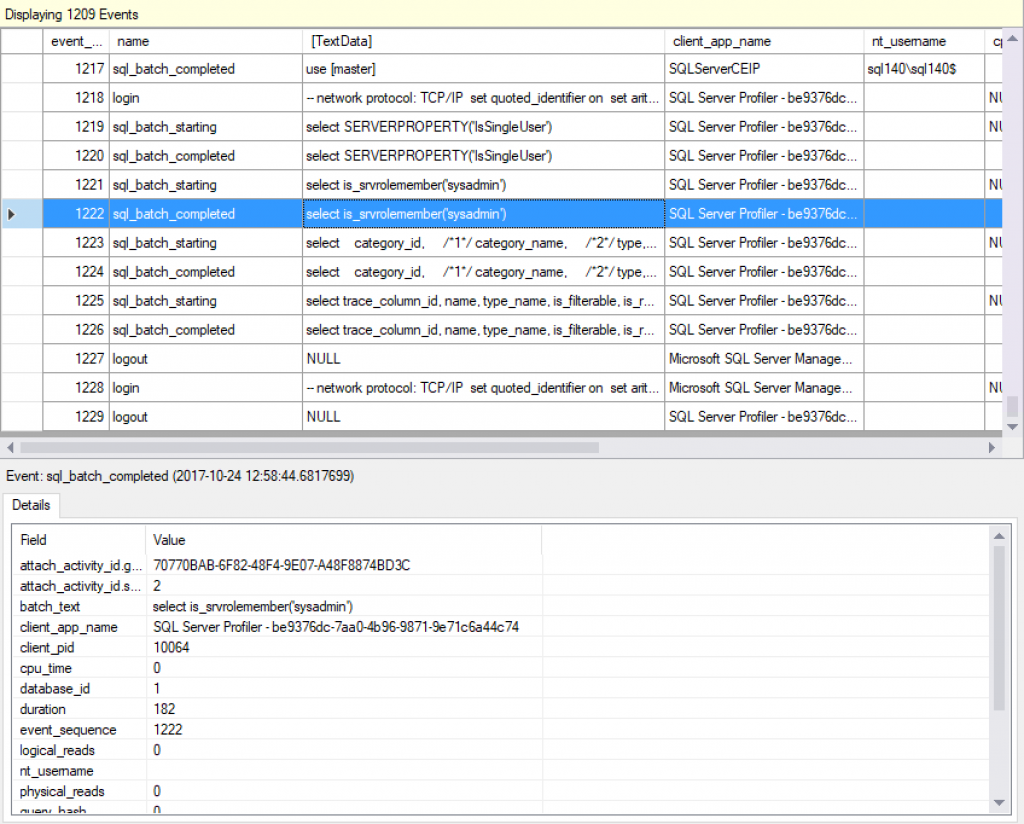
The output of a Standard XEvent Profiler session looks like this. In the top pane are the events. In the bottom pane are the details of these events.
SQL Server Profiler is dead. Long live XEvent Profiler.