Last year I wrote a series of posts about accessibility as it relates to presentations, and one aspect which I didn’t cover is within the documents themselves. We create slides with wonderful typeface choices, clear text, minimal animations, good colour choices, and so on, but what happens when we need to share those documents with other people?
If you use Microsoft Office products, there is an Accessibility Checker built right into Word, Excel, and PowerPoint, which you may have seen in passing but you really ought to know. And I’m here to remind you.
Let’s start with Microsoft Word, which is probably the most-used word processor software in the world right now. Did you know that you can analyze an existing document after you’ve prepared it long after the fact, as well as have the Accessibility Checker running while you work on a new document? The main trick with accessibility in Word is picking the right styles, formatting, and alt-text to help screen readers.
Screen readers read everything, including the things you can’t see. That means if you weren’t very good at Word five years ago and used to use the spacebar to align text, those spaces are still there today, and a screen reader will read them out loud1This is why the tabs vs spaces argument is pointless. If you care about accessibility even a little bit, you’ll use tabs..
The easiest way to get an idea of what a screen reader will display is to show formatting marks. On the Home tab of the ribbon toolbar, look for the Paragraph section, and click on the button that looks like a backwards “P.” You can also access it by typing in “formatting marks” in the “Tell me” option on the menu.
Now it will be easier for you to avoid a screen reader shouting out “SPACE SPACE SPACE SPACE SPACE SPACE SPACE SPACE SPACE SPACE SPACE SPACE SPACE SPACE SPACE SPACE SPACE SPACE” before reading the actual heading, by using the built-in text alignment features. Combined with styles (including headings, subheadings, bulleted and numbered lists), and alternate text for images that describe the images you’re pasting into the document, you’re well on your way to make your documents more accessible. The Accessibility Checker is there to summarize things you may have missed.
Excel is by its nature slightly trickier to make accessible, because there are billions of spreadsheets out there that people are too scared to change in case they break something. What you’ll usually find from the Accessibility Checker is a recommendation to increase the zoom level of your worksheets, and to increase the font size of the content. This is bound to cause some issues with printing, but keep in mind that this is for the greater good.
Printing anything from Excel is fraught, and this is a great opportunity to rethink how you display data. Does it need to be a worksheet? Can it be a chart or graph? Perhaps it would be better served by the incredible flexibility of Power BI. This is an excellent excuse to consider who is reading your content and make it more accessible to them.
Finally, we’ll talk about PowerPoint because it’s a visual tool that has room for great sadness. We want our slides to be happy, not sad. PowerPoint needs to have alternative text for every single image unless it’s a decorative element, in which case it should be marked as decorative. A screen reader will skip over decorative elements.
PowerPoint is versatile because we have multiple layers of objects, as well as bullets, indented text, text blocks, graphs, images, clip art and so on and so forth. It is very easy to get caught up in the weeds of aligning a border just so, and not realizing that there is an element further down the Z-axis that has text we’ve accidentally hidden. As with Word, a screen reader will read everything in PowerPoint, including stuff we can’t see.
What is a Z-axis? Imagine you have a two-dimensional graph with a horizontal X-axis on the bottom, and a vertical Y-axis on the left. Now imagine a third dimension, pointing upwards towards you. This is the Z-axis, and when you layer objects on top of each other, they take a position somewhere on this axis. PowerPoint’s flexibility in layers comes to bear, and the order of items in this Z-axis is incredibly important.
Fortunately, there is a very neat feature that allows us to see the layers in a Z-axis on a PowerPoint slide, and I think this is very cool. Click on Arrange > Reorder Objects, and we get the layers showing up in three-dimensional space.
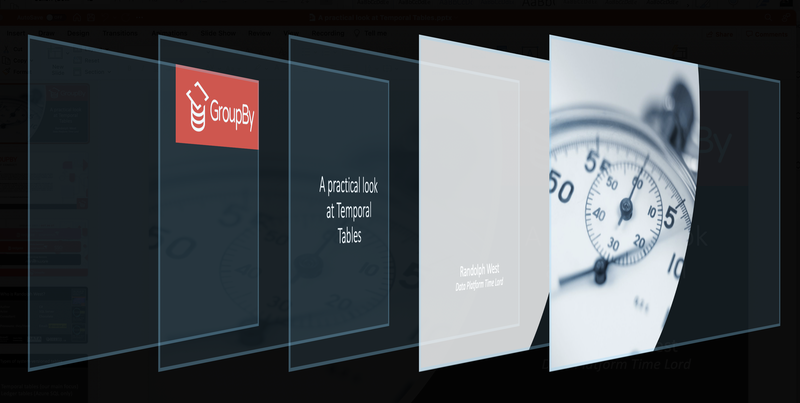
Using a pointing device, we can click and drag the order of the layers appropriately.
Approximately one billion people on the planet have some form of disability. Thinking about it in a different way, between 12 and 14 out of every 100 people have a disability. Accessibility is a human right, and it is for us to make the effort to be actively inclusive of those people.
Share your accessibility tips in the comments below.